Helping you grow - Insight and control for larger or more complex businesses.
We take care of all aspects of your business with a wide range of solutions from ERP systems to Customer Experience Management Systems. From Sales to Digital Marketing, Manufacturing and Wholesale, our solutions have helped number of businesses from different industries successfully transition to the next level.
Analyze and Understand Your Website Data

The reporting module is a universal sub-system for creating reports from data stored in the NGRPulse database. It's used for the Web Analytics module, but also for reports on documents in the content repository, workflow, e-commerce data or community activities. You can also create your own reports.
Get Powerful Insights into Your Website Content

Do you want to know which documents have been recently updated? Or which documents are scheduled to expire in the nearest days? These and other questions are effectively answered by the content reports, including:
- Content inventory report
- Documents waiting for approval
- Archived documents
- Expired documents
- Recently modified documents
- Checked-out documents
Analyze the Performance of Your On-line Store

Daily monitoring of the on-line store results is important for identifying new trends and potential threats. Using the e-commerce reports you see in more detail:
- Revenues in the given time period
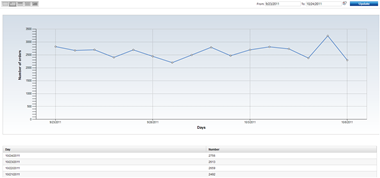
- Number of orders in the given time period
- Current inventory
- Top customers
Easily Create and Customize Reports

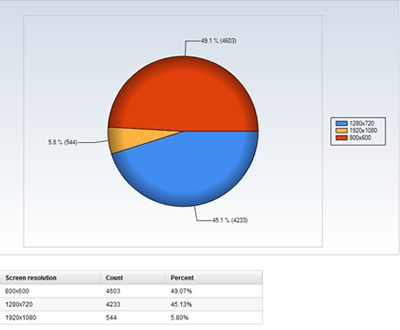
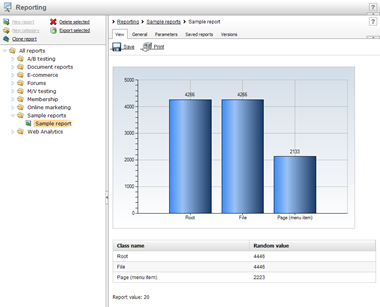
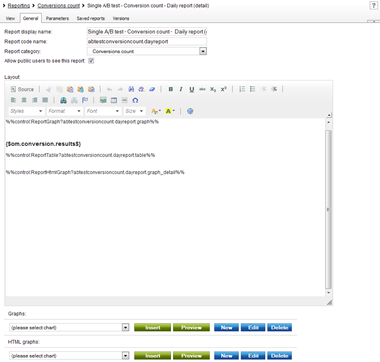
You can design the layout of your report and insert a chart (line, column, pie), table or scalar value that display data specified by your SQL query.
You can also define a filter for your report using various fields, such as textbox, date-time picker, drop-down list and others.
You can also print or save a report at any time and make a snapshot of your data in the given moment.


